Signal Room
What is actually being bought
What trades, what moved, and what each card's own series implies next. Where the data isn't there yet, the list says so.
Showing Pokémon
High demand
High conviction
Top gainers/losers
Smart analysis
Grading opportunities
High demand
Budget High Demand
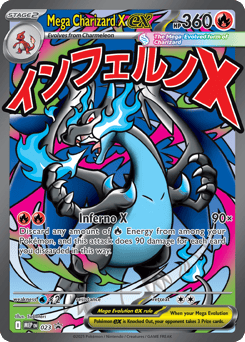
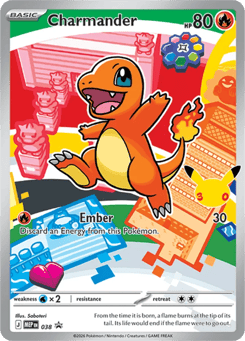
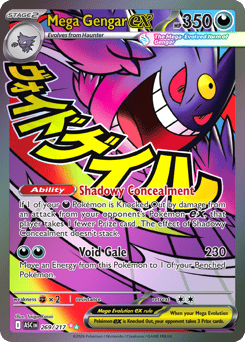
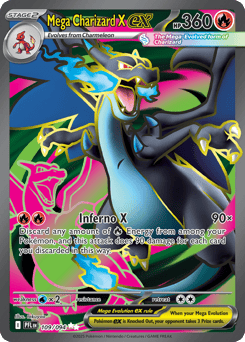
$10 to $50. Where volume is highest and a position can be built cheaply. Ranked by how often a copy actually changes hands.
| # | Card | Market Price | Rating | Composite |
|---|---|---|---|---|
| 1 | $27 | Hold | +14 | |
| 2 | $27 | Hold | +12 | |
| 3 | $22 | Hold | +13 | |
| 4 | $39 | Sell | −21 | |
| 5 | $20 | Sell | −29 |

Not investment advice. Every rating, signal and pick here is the output of a model over price history and population data. Trading cards are illiquid and easily moved by a single listing; treat this as a starting point for your own research, never as a reason to skip it.
▸How these lists are built — and why a card might be missing from one
On volume
Providers count sales over different windows — about three months for Pokémon, a year elsewhere — so every figure is normalised to a per-day rate first. A card missing from a demand list has no volume recorded, which is not the same as no sales.
On raw prices
Raw lists start at $10. Below that a percentage describes the price feed, not the market — a cent of rounding on a $1.20 common is a full percent — so bulk would take every place on arithmetic alone. Slabs need no bound; the grading fee is already a floor.
On smart analysis
The third row reads the shape of a card's own series, so it covers only cards with a dozen or more readings — most of Pokémon, a slice of One Piece, growing with every ingest. Where a series jumps too far in one reading to be a market move, the earlier readings are dropped: that is the card being repointed at a different product.